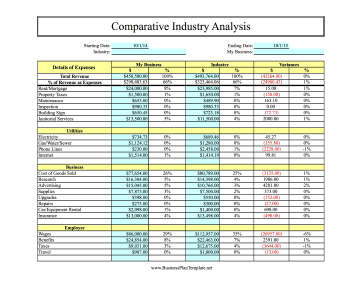

New businesses can compare their projected or actual expenses against the average industry prices and provide variance percentages. Users fill in the blue boxes; the rest is calculated automatically.
Sample text from Comparative Industry Analysis:
Comparative Industry Analysis
| Starting Date | Ending Date | ||
| Industry | My Business |
|
Details of Expenses
|
My Business
|
Industry
|
Variances
|
|||
|
$
|
%
|
$
|
%
|
$
|
%
|
|
|
Total Revenue
|
||||||
|
% of Revenue as Expenses
|
||||||
|
|
||||||
|
|
||||||
|
|
||||||
|
|
||||||
|
|
||||||
|
|
||||||
|
|
||||||
|
Utilities
|
||||||
|
|
||||||
|
|
||||||
|
|
||||||
|
|
||||||
|
|
||||||
|
Business
|
||||||
|
|
||||||
|
|
||||||
|
|
||||||
|
|
||||||
|
|
||||||
|
|
||||||
|
|
||||||
|
|
||||||
|
|
||||||
|
Employee
|
||||||
|
|
||||||
|
|
||||||
|
|
||||||
|
|
||||||
|
|
||||||